Real- Time Monitoring Electrification Of Conveyors
Project Overview:
Real-time Conveyors monitoring and analysing application.
Technology:
ReactJs, HTML5, CSS3, NodeJs, Cassandra
Features:
The ultimate goal is to design an application (Real time status monitoring system using GSM) to efficiently monitor the status and data of ELECTRONIFICATION OF CONVEYORS using GSM.
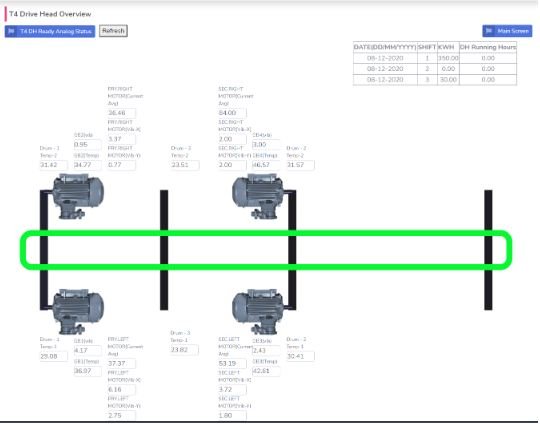
This application has the capability to monitor three driver stations as of now, each driver station has four motors. Every finite interval GSM modem will push the data into the cloud system from the PLC. So, our main goal is to receive the data without fail and display in the proper recommended format.
Since we have already done projects in IoT, we have planned to use NodeJs and Reactjs to develop this application. Since nodejs is an asynchronous, Non- Blocking I/O and single threaded, it’s handling multiple http requests with high throughput. We have used the websocket to update the real-time value in the user interface.
In the database part, we have chosen Cassandra which supports more write operations compared to other databases. We have created a SimpleStrategy keyspace with replication factor to achieve fault-tolerant and data consistency. And also we have configured the Time Window Compaction Strategy which will be very fast to fetch the data using time period based operations.
The user interface was developed in ReactJS which is a more flexible and component based framework. The virtual DOM concept in ReactJs provides fast rendering and better performance.
- Users can view the diagrammatic representation of each driver station with real-time data. We have done some animation to display the running motors.
- The user can generate (5min, 15 min,30 min,Hourly,Shiftwise, Day) wise report based on the given filter and also can download the report as Excel format.
- The same functionality can be applied to see the reports in the interactive graph view and also the user can download the graph as an image.
- The user can select the parameters which need to be plotted as a graph.
These are the key features in the application. Now, we are going to integrate some more driver stations and support low bandwidth communication.


